
Introduction to observability - faster problem diagnosis
Introduction to observability - faster problem diagnosis
Diagnosing problems in software systems can be challenging - but in distributed systems, especially those built on microservices where a single request passes through many services, it becomes a whole new level of complexity. It’s not always easy to even locate where to look for the cause of a problem, not to mention reproducing bugs locally. In such systems monitoring is not enough, because it lacks the context needed to understand complex cross-service interactions. It tells you when something breaks, but not how or why it broke. What is needed is the solution that correlates signals across distributed components and enables fast root cause analysis. Before exploring observability in detail, it is important to distinguish it from traditional monitoring.
Monitoring vs Observability
Monitoring involves collecting and observing predefined metrics and indicators, such as CPU usage, memory, number of errors, response time.
In other words, it answers the question: “Is the system functioning properly?”
Observability is a broader approach that allows you to understand why a system behaves a certain way, based on internal data (logs, metrics, traces).
It answers the question: “Why is the system not functioning properly?”
Key difference:
- Monitoring = detecting problems (alerts, metrics)
- Observability = diagnosing and understanding problems
Monitoring is a part of observability, but not the other way around - observability is a more comprehensive concept that includes logs, metrics, and traces, which together provide a fuller picture of the system.
Key Components of Observability
Observability does not come from a single tool or feature, but from a thoughtfully combined set of elements. When done well, these components turn a system from a black box into one that can be clearly understood, explored, and reasoned about in practice. Let’s take a closer look at them.
1. Metrics
In simple terms, a metric is a numeric value measured overtime that describes how a system is behaving. You can think of metrics as the "health vitals" of an application.
They are typically continuous numerical measurements. For example, a CPU usage metric might look like this over time
- 10:00 → 45%
- 10:01 → 52%
- 10:02 → 71%
- 10:03 → 68%
Because metrics are collected over time, they allow us to observe trends and changes in system behavior.
Their structured nature makes them easy to aggregate using calculations such as averages, minimums, maximums, and percentiles. This makes them especially effective for detecting patterns like traffic spikes, resource saturation, or performance degradation.
Metrics are also commonly displayed as charts on dashboards, where you can visually track how a system evolves over time. For example, a line graph might show CPU usage gradually increasing or request latency suddenly spiking.
In addition, metrics can be aggregated across time periods or multiple instances. You can calculate averages, maximums, percentiles, or sums, which makes them very useful for identifying broader system patterns such as:
- traffic spikes
- resource saturation
- performance degradation
Because of this structure, metrics help answer questions such as:
- Is the service fast or slow?
- Is traffic increasing or decreasing?
- Are resources (CPU, memory, disk) running out?
As a result, metrics are often the first layer of detection in observability. They allow teams to quickly notice unusual behavior before it significantly affects users.
2. Structured events
A key role in observability systems is played by structured events. They alter a way in which systems communicate their internal state. Look at the example below:
Traditional log messages are transformed into structured, queryable data typically represented as JSON or key-value pairs. It makes it possible to debug faster, analyze deeper, and in general to understand any behavior of a system. Because the data is consistently organized, it becomes possible to ask precise questions about any aspect of the system’s telemetry.
To make this effective in practice, logs must be expressed at the right level of abstraction: not so low-level that they become noisy and hard to interpret, and not so high-level that they hide the operational details needed for debugging. In other words, each log entry should represent a meaningful system event with enough structured context—such as service name, request identifiers, operation type, outcome, latency, and relevant domain attributes - to allow engineers to reconstruct what happened without needing to infer missing pieces from scattered or ambiguous messages.
For example, consider a checkout failure in an e-commerce system. A poorly abstracted log might look like:
“Error occurred in payment module”
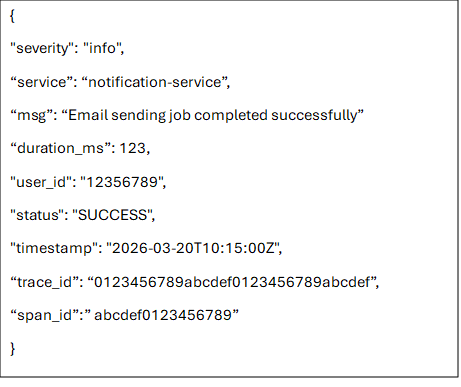
This is almost useless in practice because it lacks context, structure, and actionable signals. A better version would explicitly describe the event and its attributes:

3. Traces – following request through distributed systems
A trace represents the end-to-end journey of a single request as it travels through different components of a system. It captures not just what happened, but where and in what order events occurred across services.
At the heart of a trace are spans - individual units of work. Each span corresponds to a specific operation, such as an API call, a database query, or a message queue interaction.
How does it work
- A request starts → a trace ID is created
- The first operation becomes the root span (with its own span ID)
- Each subsequent operation:
- Creates a new span ID
- References its parent span (span of a previous operation)
- Uses the same trace ID
- When calling another service:
- The system sends a traceparent header
- The receiving service extracts it and continues the trace
Traceparent is a standardized header used to propagate tracing context between services. It is defined by the W3C TraceContext specification. Contains the trace ID, parent span ID, and additional metadata. Traceparent is sent along with requests (e.g. HTTP headers)
A typical traceparent looks like this:

It consists of:
- Version (00 - indicates the format version of the W3C Trace Context specification being used)
- Trace ID (4bf92f3577b34da6a3ce929d0e0e4736)
- Parent Span ID (00f067aa0ba902b7)
- Trace Flags (01)
Trace Flags indicate trace-level options. Most importantly whether a trace is sampled, so that all services in a distributed system can consistently decide whether to record and export the trace. Exporting every trace would generate too much data, increase costs, and reduce performance. There is no single fixed rule for sampling traces, but a rule of thumb would be: sample a small percentage of all traffic and always capture traces for errors and performance issues.
From Symptom to Root Cause: A Tracing Example
Let’s consider the following scenario: a user reports a slow checkout. Logs show nothing obvious and metrics look healthy. This is a common observability challenge - aggregate metrics can appear healthy even when individual requests are suffering from high latency. To understand what’s really happening, we need visibility into how a single request behaves as it moves through multiple services. This is where distributed tracing becomes invaluable.
Imagine a single checkout request flowing through a couple of services. Each horizontal bar in the trace represents the time spent in a given service. When we inspect the trace, a clear pattern emerges: most services respond quickly, but one stands out as a bottleneck.
The visualization reveals that most of the total request latency is spent in the payment-service.
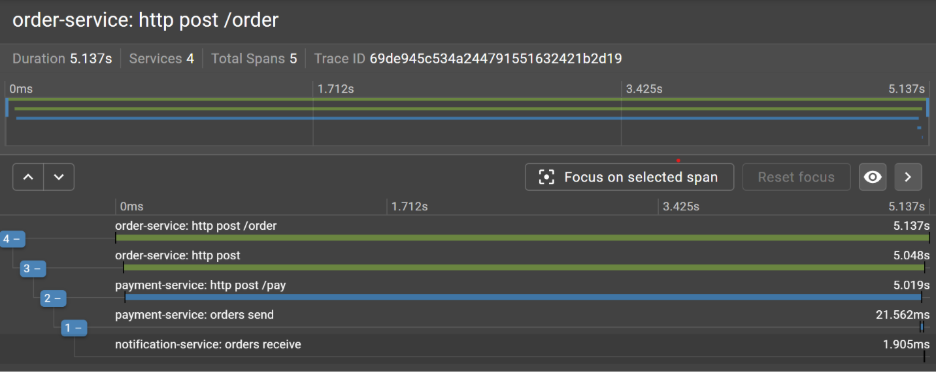
What initially appeared to be a vague performance issue clearly localized. Instead of guessing where the slowdown might be, we can immediately identify the service responsible for the delay and focus our investigation there.
The next step is to determine whether this is an isolated incident or part of a broader pattern. A single slow request might be an anomaly - but repeated occurrences often point to a systemic issue.
To answer this, we look for other traces that exhibit similar characteristics: elevated latency in the same service, similar request paths, or shared contextual attributes such as region, user segment, or payment method. This is where structured events become especially valuable.
Because structured logs and trace metadata include consistent fields - we can filter and group traces efficiently. Instead of manually inspecting individual requests, we can query for patterns. By correlating these dimensions, patterns begin to emerge. For example, we might discover that all slow requests involve a specific third-party payment gateway or only occur under high load conditions. What started as a single trace has now evolved into a well-defined hypothesis backed by data.
At this stage, observability enables a shift from reactive debugging to informed diagnosis. Rather than asking “what went wrong in this case?”, we can now ask “under what conditions does this problem occur?” - and more importantly, how to reproduce and fix it.
How to get started with Observability
If you are beginning your journey with observability, consider starting with OpenTelemetry. It offers a vendor-neutral standard for instrumenting applications and collecting logs, metrics, and traces. Rather than being locked into a specific vendor or backend, OpenTelemetry provides a unified instrumentation layer that can export telemetry data to a variety of observability platforms.
Once you have instrumentation in place, the next step is choosing where your data goes. You can use fully managed platforms that unify these signals in a single environment. Examples include Datadog, New Relic, and Honeycomb, which provide integrated storage, querying, and visualization across logs, metrics, and traces.
Alternatively, you can build an observability stack using specialized tools for each signal type. Logs are typically handled by systems like Elasticsearch (as part of the Elastic Stack) or Grafana Loki. Traces are collected using distributed tracing systems such as Jaeger, Grafana Tempo, or Zipkin. Metrics are commonly stored in Prometheus and visualized with Grafana dashboards. This modular approach gives more control and flexibility but also requires more operational effort to integrate and maintain.
Conclusion
As architecture continues to grow in complexity, observability becomes a fundamental requirement for maintaining reliability, reducing mean time to resolution, and understanding system performance underreal-world conditions. It helps to move beyond surface-level monitoring and reconstruct the full execution path of a request, identify bottlenecks, and localize faults across services.
